Rational
My 3rd ski season in montérégie is coming, and this post uses a very basic machine-learning-unsupervised-clusterring algorithm to show an interesting analysis about how to choose your next ski journey.
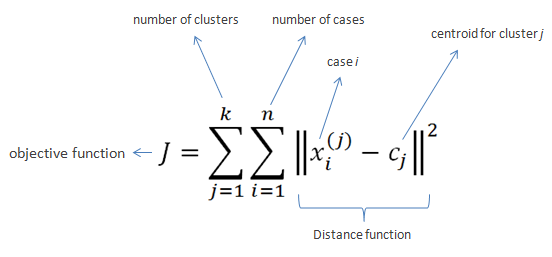
Algorithm
Quote from wiki page
k-means clustering is a method of vector quantization, originally from signal processing, that is popular for cluster analysis in data mining. k-means clustering aims to partition n observations into k clusters in which each observation belongs to the cluster with the nearest mean, serving as a prototype of the cluster. This results in a partitioning of the data space into Voronoi cells.
The problem is computationally difficult (NP-hard); however, there are efficient heuristic algorithms that are commonly employed and converge quickly to a local optimum. These are usually similar to the expectation-maximization algorithm for mixtures of Gaussian distributions via an iterative refinement approach employed by both algorithms. Additionally, they both use cluster centers to model the data; however, k-means clustering tends to find clusters of comparable spatial extent, while the expectation-maximization mechanism allows clusters to have different shapes.
Data
Collecting data is always essential to the success of ML model. Our context is to group various ski resorts near montreal, or more specifically my home into different clusters (term used in machine learning)
The columns represents all the features to consider when dealing with K-means.
| name | distance(km) | altitude(m) | vertical drop(m) | Skiable area(acres) | lifts | night | easy | intermediate | difficult | extreme |
|---|---|---|---|---|---|---|---|---|---|---|
| st-bruno | 3.4 | 175 | 134 | 50 | 4 | true | 10 | 6 | 2 | 1 |
| bromont | 86.1 | 565 | 385 | 450 | 9 | true | 35 | 54 | 26 | 26 |
| owl’s head | 139 | 753 | 540 | 163 | 8 | false | 15 | 17 | 9 | 12 |
| orford | 122 | 850 | 589 | 245 | 8 | false | 21 | 16 | 8 | 17 |
| sutton | 114 | 962 | 460 | 230 | 9 | false | 15 | 18 | 11 | 16 |
| st-sauveur | 91.3 | 416 | 213 | 142 | 7 | true | 9 | 9 | 16 | 6 |
| olympia | 92.8 | 440 | 200 | 80 | 3 | true | 14 | 10 | 6 | 7 |
| morin heights | 101 | 465 | 200 | 80 | 4 | true | 10 | 10 | 10 | 5 |
| mont-blanc | 143 | 580 | 208 | 140 | 7 | true | 7 | 12 | 18 | 6 |
| mont-tremblant | 160 | 875 | 645 | 665 | 11 | false | 22 | 28 | 32 | 14 |
| jay peak | 136 | 1209 | 656 | 385 | 9 | false | 14 | 31 | 34 | 0 |
| la reserve | 132 | 700 | 305 | 100 | 2 | false | 9 | 8 | 12 | 11 |
| le massif | 332 | 806 | 770 | 406 | 7 | false | 13 | 20 | 19 | 8 |
| mont saint-anne | 283 | 800 | 625 | 547 | 5 | true | 15 | 33 | 14 | 9 |
| massif du sud | 309 | 915 | 400 | 226 | 2 | false | 6 | 3 | 14 | 9 |
| stoneham | 262 | 593 | 346 | 333 | 4 | true | 8 | 11 | 16 | 7 |
Code Snippet
A quick dirty python code to generate all code needed for google map api
import io
import json
import numpy as np
from sklearn.cluster import KMeans

columns = (
    'distance','alt','vertical','skiable terrain','lifts','night',
    'easy','intermediate','difficult','extreme')

def parse_ski(stations):

    for col in columns:
        if col == 'night': # doesn't make sense to scale boolean value
            for station in stations:
                station[col] = int(station[col])
        else:
            # mean feature scaling
            buf = [station[col] for station in stations]
            minval = min(buf)
            maxval = max(buf)
            mean = sum(buf)/len(buf)
            for station in stations:
                station[col] = (station[col] - mean)/(maxval-minval)

    return io.StringIO('\n'.join(
        (','.join((str(station.get(col)) for col in columns))
        for station in stations)
    ))

# GPS location not shown in the table
stations = json.loads('your json raw data')
matrix_fp = np.loadtxt(parse_ski(stations), delimiter=',')
colors = {
    k:v
    for k, v in enumerate(('#4E4EB2','#FF5600','#66CC46','#99A695','#0001FF',))}

for num in (2, 3, 4, 5):
    print('clusters numbers: ', num)
    km = KMeans(num, init='k-means++').fit(matrix_fp)
    locations = {
        station['name']: {'center': station['gps'], 'color': colors[lbl], 'group': lbl}
        for station, lbl in zip(stations, km.labels_)
    }
    print(locations)
For each locations map we can visaulize the result in google map using the official demo examples.
// This example creates circles on the map, representing populations in North
// America.

//using the locations generated by python code
var citymap = {
  "jay peak": {"color": "#14CCC8", "center": {"lng": -72.5071207, "lat": 44.9376778}}, "Stoneham": {"color": "#FFDF43", "center": {"lng": -71.3978895, "lat": 47.0303657}}, "massif du sud": {"color": "#14CCC8", "center": {"lng": -70.4917626, "lat": 46.6213833}}, "st-bruno": {"color": "#FFDF43", "center": {"lng": -73.336873, "lat": 45.558709}}, "le massif": {"color": "#14CCC8", "center": {"lng": -70.59809, "lat": 47.2820407}}, "la reserve": {"color": "#14CCC8", "center": {"lng": -74.183668, "lat": 46.286398}}, "orford": {"color": "#14CCC8", "center": {"lng": -72.223443, "lat": 45.3176101}}, "olympia": {"color": "#FFDF43", "center": {"lng": -74.1552723, "lat": 45.9004148}}, "owl's head": {"color": "#14CCC8", "center": {"lng": -72.2977126, "lat": 45.0753163}}, "morin heights": {"color": "#FFDF43", "center": {"lng": -74.270762, "lat": 45.899502}}, "sutton": {"color": "#14CCC8", "center": {"lng": -72.564034, "lat": 45.104728}}, "st-sauveur": {"color": "#FFDF43", "center": {"lng": -74.1598336, "lat": 45.8815953}}, "mont-blanc": {"color": "#FFDF43", "center": {"lng": -74.4849394, "lat": 46.1090299}}, "mont-tremblant": {"color": "#B25B9F", "center": {"lng": -74.732755, "lat": 46.1756729}}, "mont saint-anne": {"color": "#B25B9F", "center": {"lng": -70.9409543, "lat": 47.0864416}}, "bromont": {"color": "#B25B9F", "center": {"lng": -72.6543549, "lat": 45.2909317}}
};

function initMap() {
  // Create the map.
  var map = new google.maps.Map(document.getElementById('map'), {
    zoom: 8,
    center: {'lat': 46.1587401,'lng': -71.0195173},
    mapTypeId: 'terrain'
  });

  // Construct the circle for each value in citymap.
  // Note: We scale the area of the circle based on the population.
  for (var city in citymap) {
    // Add the circle for this city to the map.
    var cityCircle = new google.maps.Circle({
      strokeColor: '#AABBAA',
      strokeOpacity: 0.5,
      strokeWeight: 1.5,
      fillColor: citymap[city].color,
      fillOpacity: 0.9,
      map: map,
      center: citymap[city].center,
      radius: 3500
    });
  }
}
Result
Before any analysis, we can think the best cluster number should be 3 or 4.
- The primary difference is the size of moutain: vertical drop and skiable area. This basically decides the numbers of trails
- The distance from home is also another important thing to consider
- minor factor also includes whether openning at night
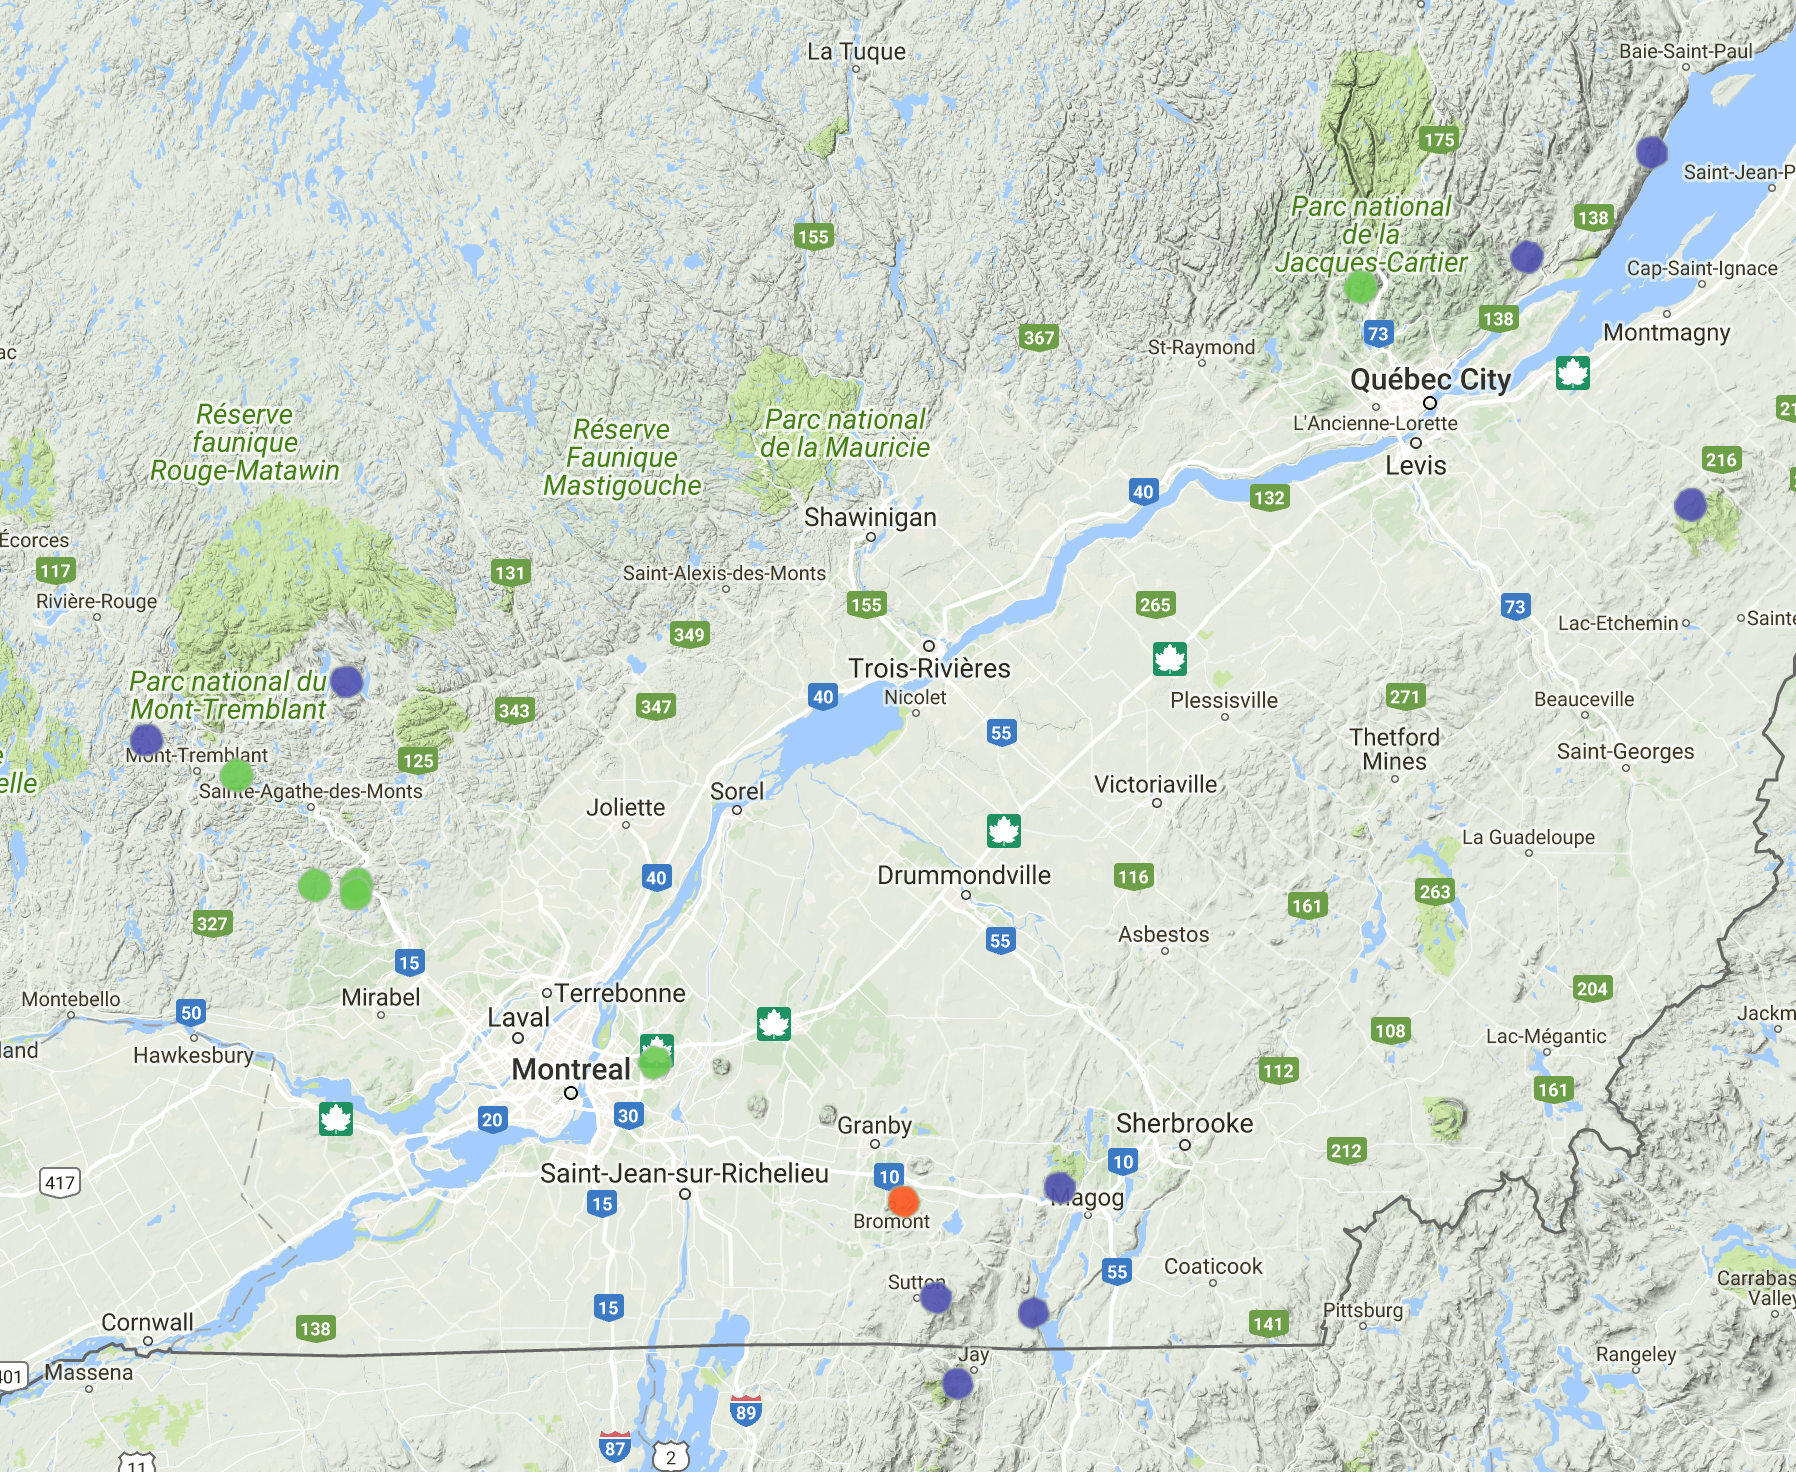
Cluster:2
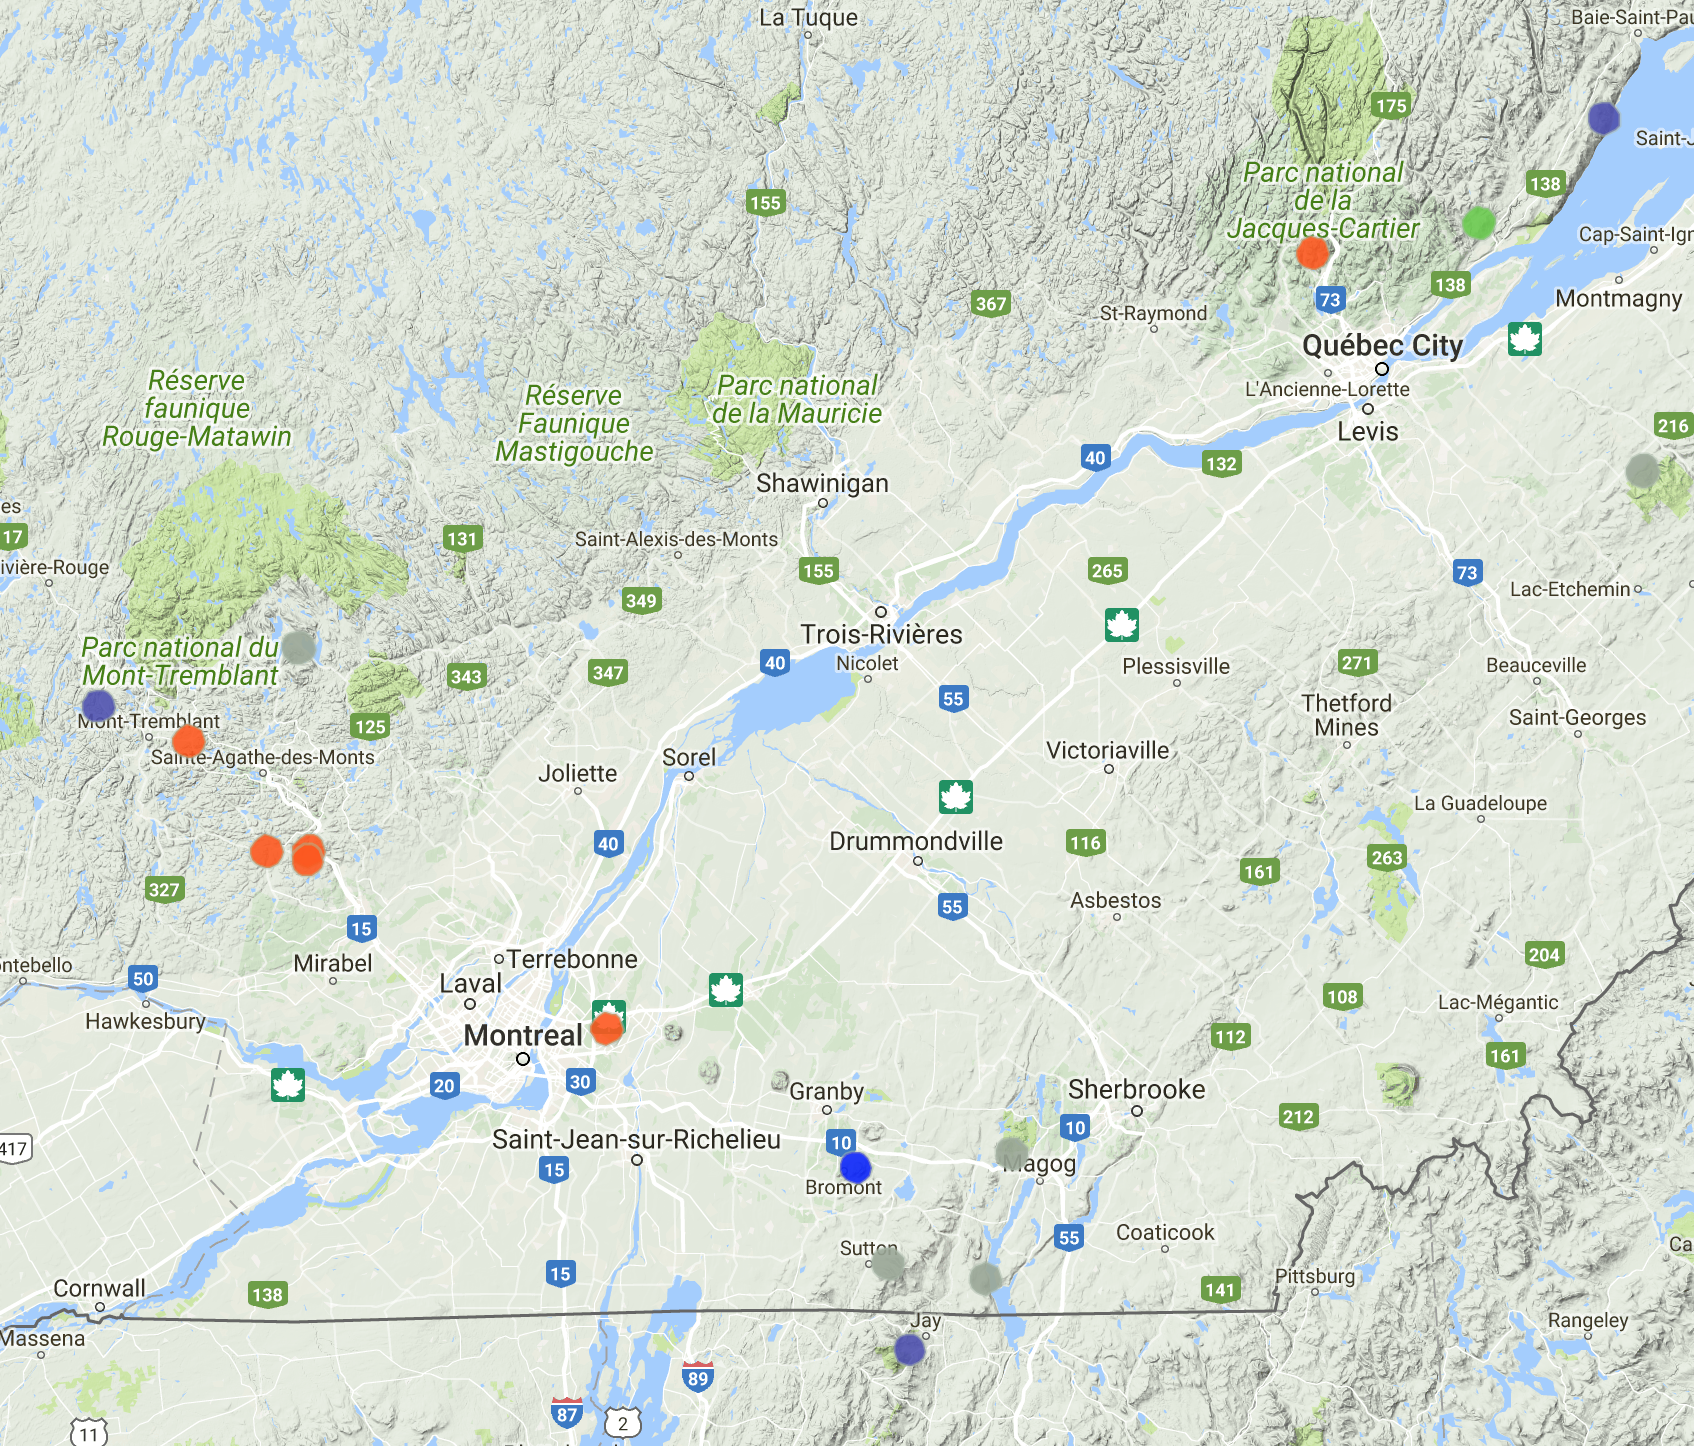
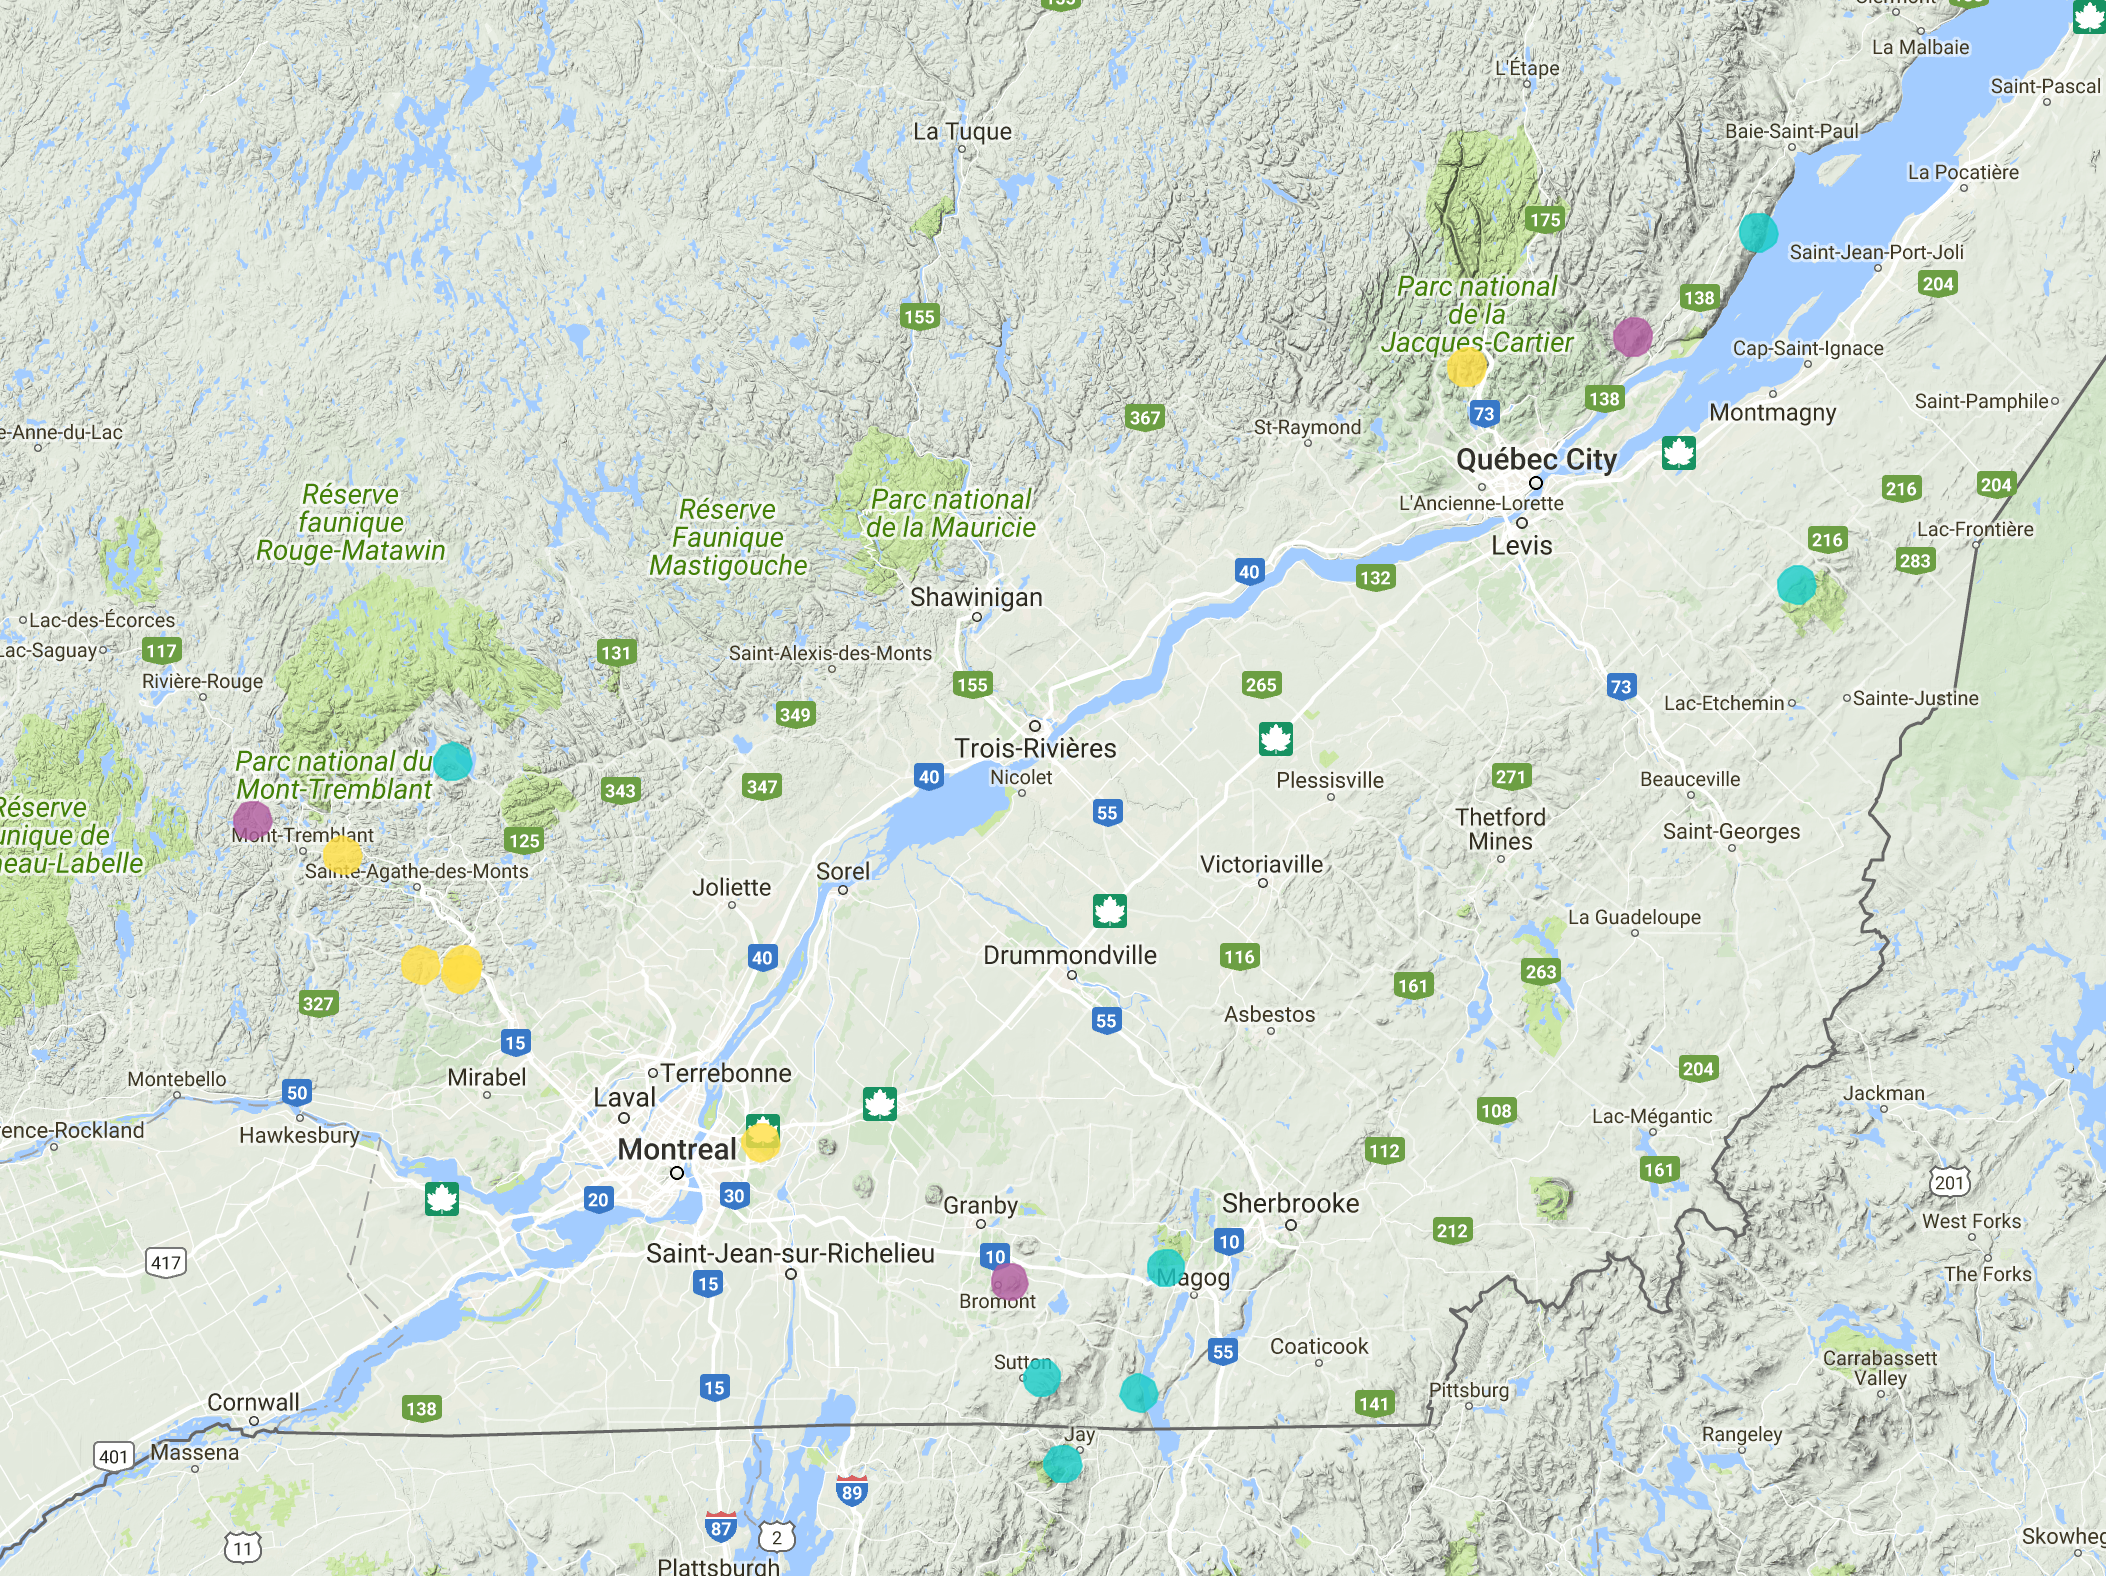
Cluster 3
Note the initialization have big impact on output, this is a perfect example showing two outcomes, but interestingly, I think both of them make sense.
The first result has Bromont as single cluster, which reminds some of AlphaGo’s moves are labelled as Go Seigen style. It’s the biggest resort in the area with night operation hours.
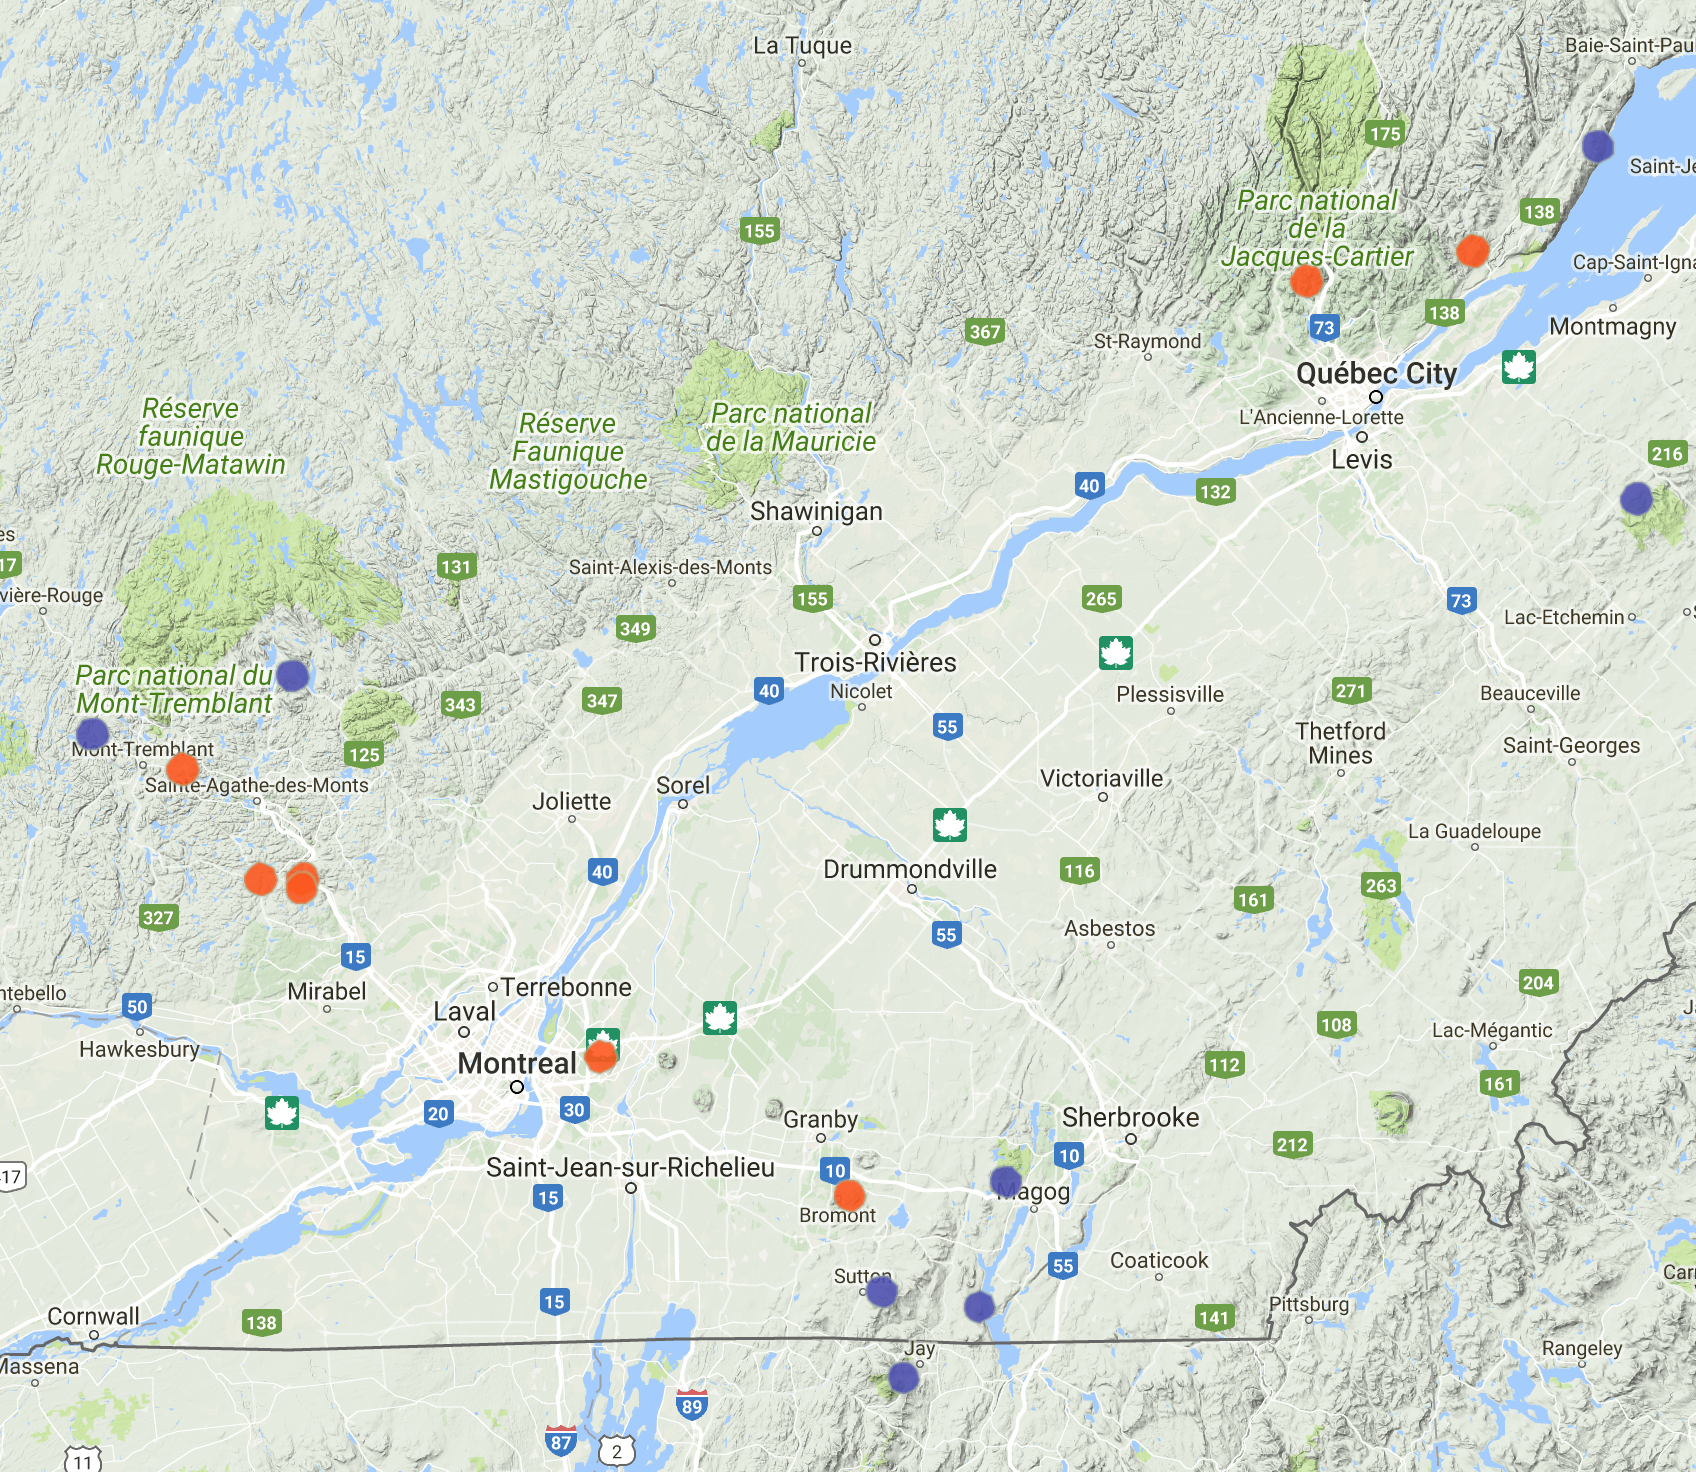
The second puts Mont-Tremblant, Bromont and Saint-Anne together. All 3 are very tourist-oriented and successful in commercial perspective.
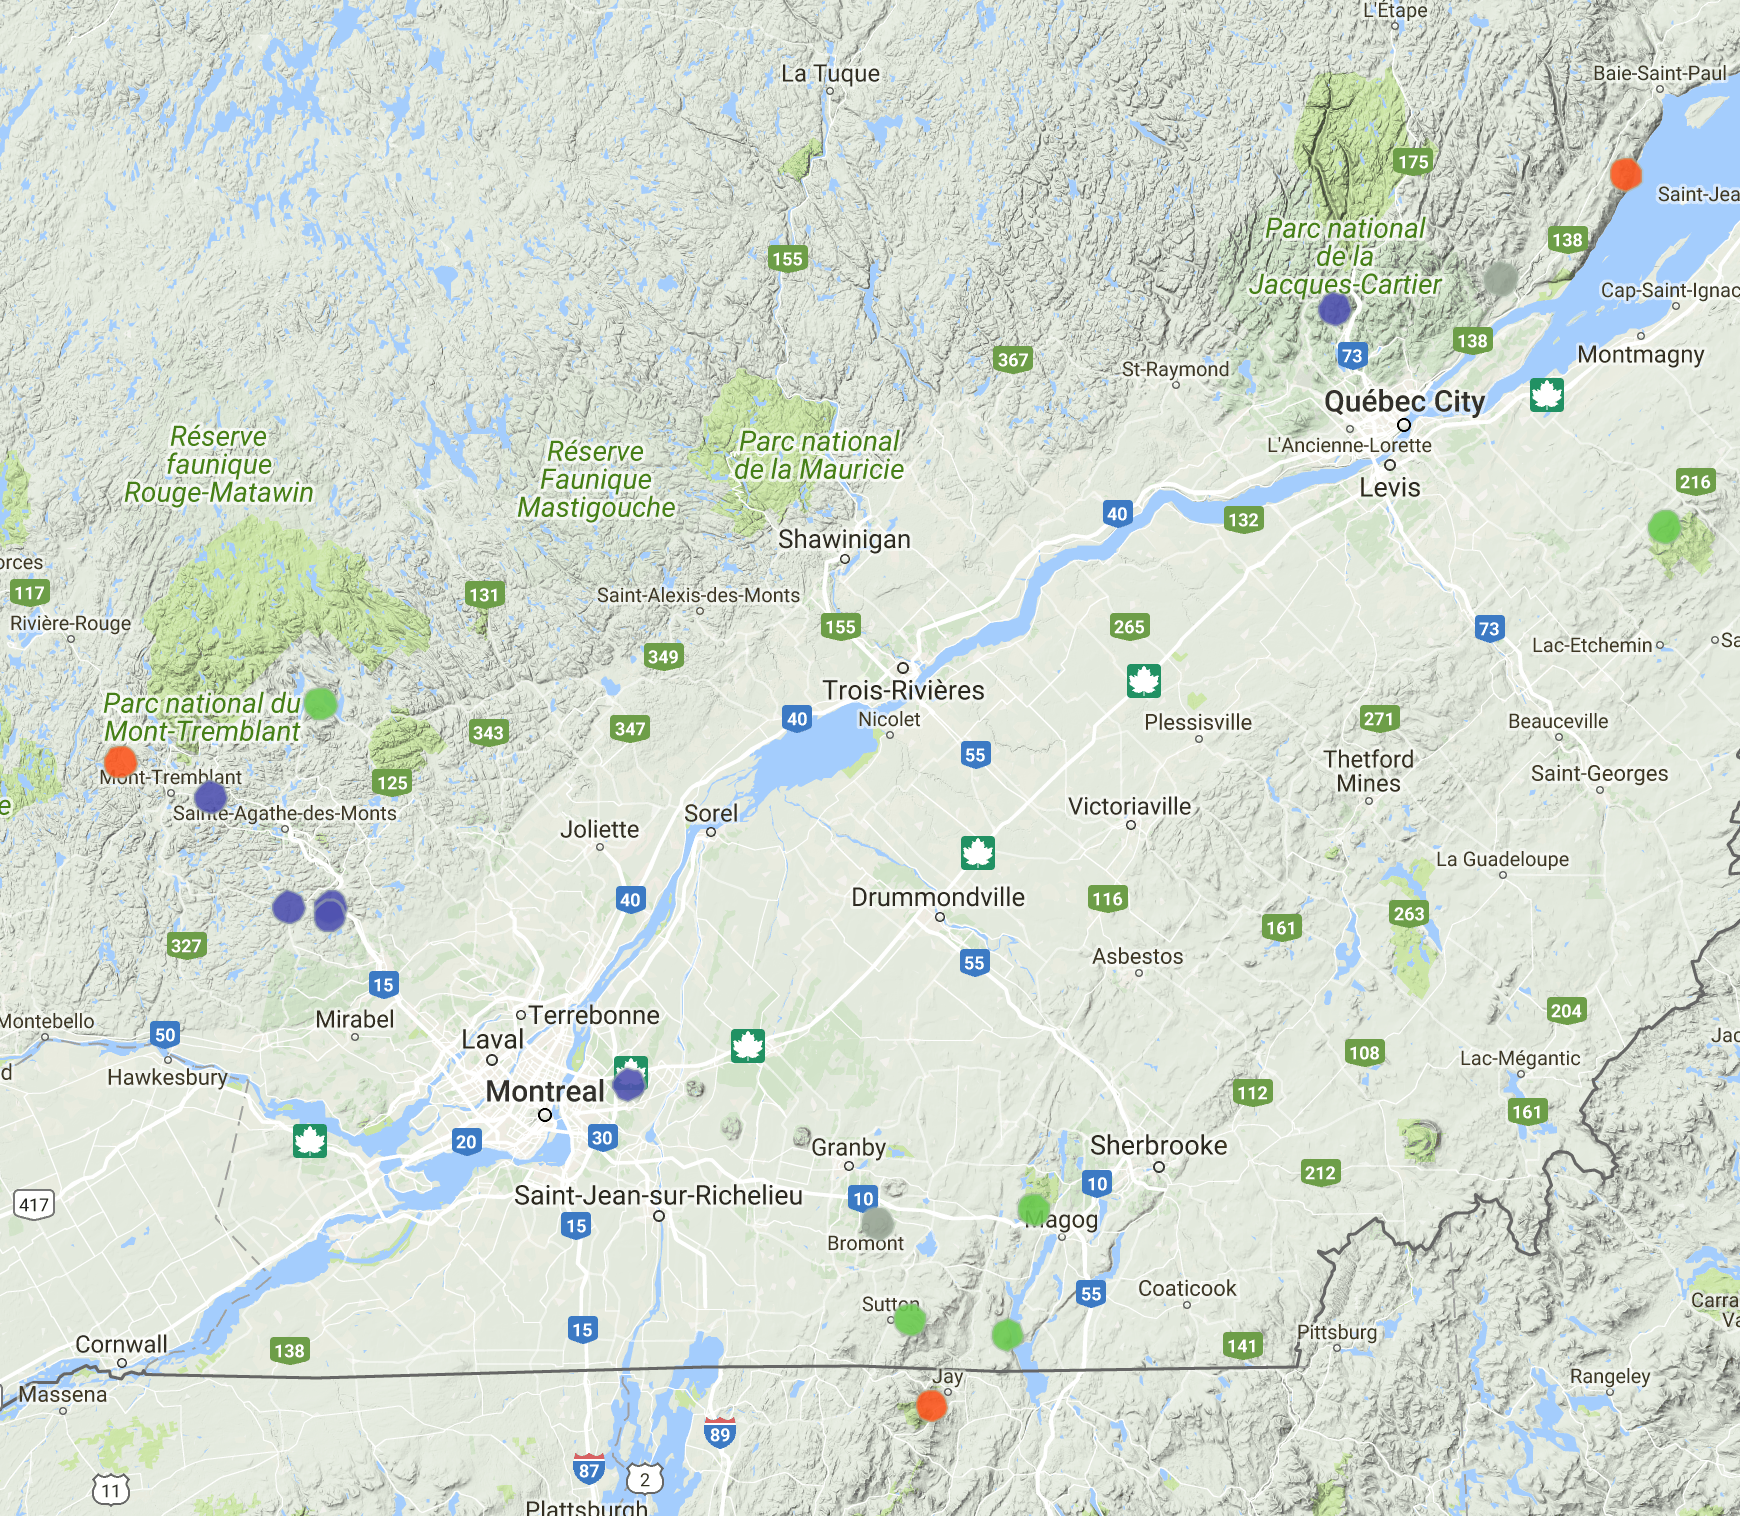
Cluster 4
Cluster 5